In this article, I will share convenient tips. Before .NET core, we used third-party or open-source software to analyze the .net application. But, the good news is that Microsoft is providing free tools to analyze the .net application. One of them is tracing the .net core application.
Install the following tool by running
dotnet tool install --global dotnet-trace
Get the process id of Kestral
(Get-NetTCPConnection -LocalPort 5000).OwningProcess[0]
Run the Web Server and run the following command
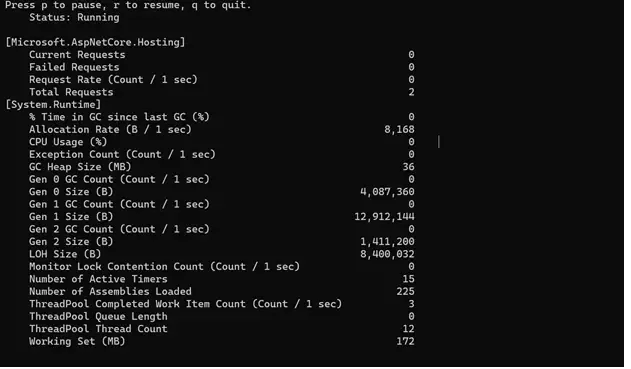
dotnet counters monitor -p ProcessId Systen.Runtime Microsoft.AspNetCore.Hosting
